I’m Marisa Dreher and my journey into data visualization began at Howard Hughes Medical Institute’s Janelia Research Campus, where I collaborated with scientists to navigate two electron microscopy datasets of a fruit fly brain. These datasets were created to generate a detailed map of every neuron and its connections in a brain the size of a poppy seed. The hemibrain dataset (Scheffer et al. 2020), the most complete brain wiring diagram to date, was publicly released in January 2020. It provides about one-third of a fruit fly brain and contains over 25,000 neurons with 3 million connections. While assisting Dr. Gerald Rubin in exploring and visualizing neural circuits underlying sleep and aggression, I discovered my passion for working with complex data to create insightful, well-designed visualizations. My work on these projects resulted in co-authorship on four scientific publications during my four years at Janelia.
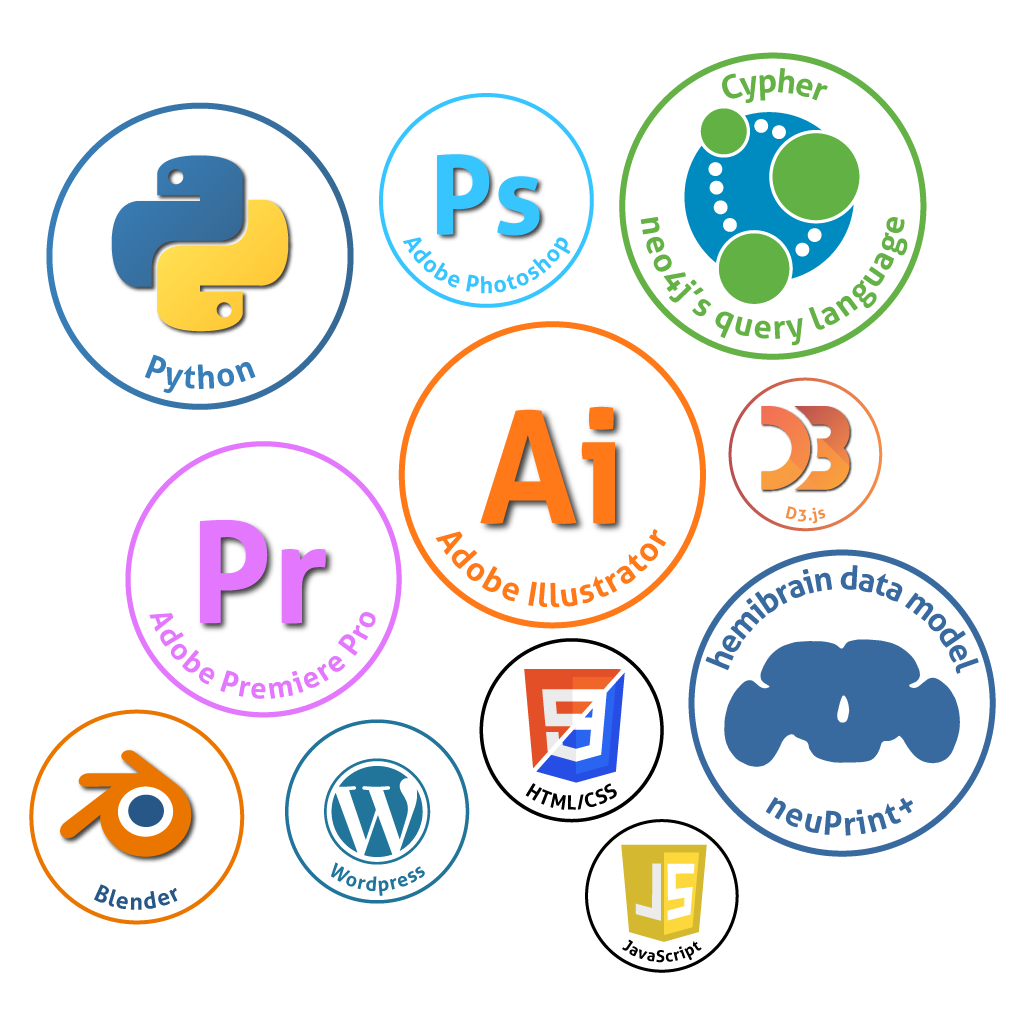
After graduating with a degree in Neuroscience and working with scientists at Janelia, I combined my love for data, science, and art and founded Dreher Design Studio. As a freelance data visualization designer and artist, I develop visualizations and illustrations for clients across the scientific community and beyond. I am always eager to expand my toolbox and explore new techniques and datasets. I can enhance existing visualizations, or take on the entire data visualization process, from data processing and analysis, to visualization design and development.
Your data is unique and you work hard to collect it. Get in touch to discuss your next visualization project.


